Knowledge Base
Last Updated: 2026-07-30
Wireshark Filter for Port 13400 and DoIP Traffic
Port 13400 is the default destination engineers look for when narrowing Wireshark captures down to Diagnostic over IP traffic.
Evidence Summary
Interpret the retained observation before assigning a diagnostic conclusion.
Observed
Correct DoIP transport lane found, but the session fails after activation
Supported interpretation
Only the retained, approved observation is supported.
Not established
Not determined from this retained window; the rapid FIN sequence supports a post-activation transport-stability check.
Recommended next check
Anchor the first transport teardown event after Routing Activation Response payload type 0x0006 (code 0x10) before adding more Wireshark display filters.
Visual Evidence
These panels are reviewed, public-safe, role-based event summaries. They are not raw packet captures or screenshots.
Wireshark Handshake And Close Snapshot
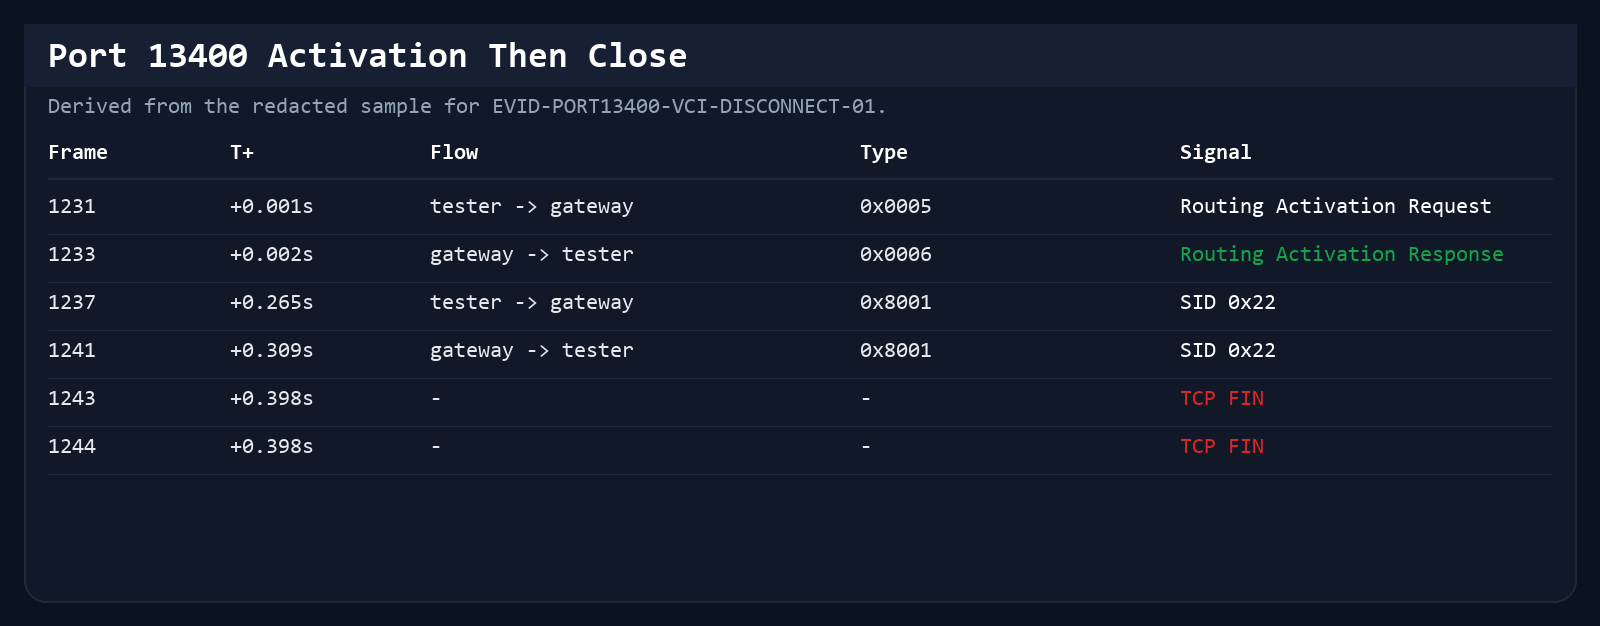
Generated from the redacted sample for EVID-PORT13400-VCI-DISCONNECT-01.
Evidence reference: EVID-PORT13400-VCI-DISCONNECT-01
Derived from: original frame window 1230-1245
Normalized by: DiagAgent
Original packet count: compact activation window extracted from a larger field capture
Analyzer Summary Screenshot
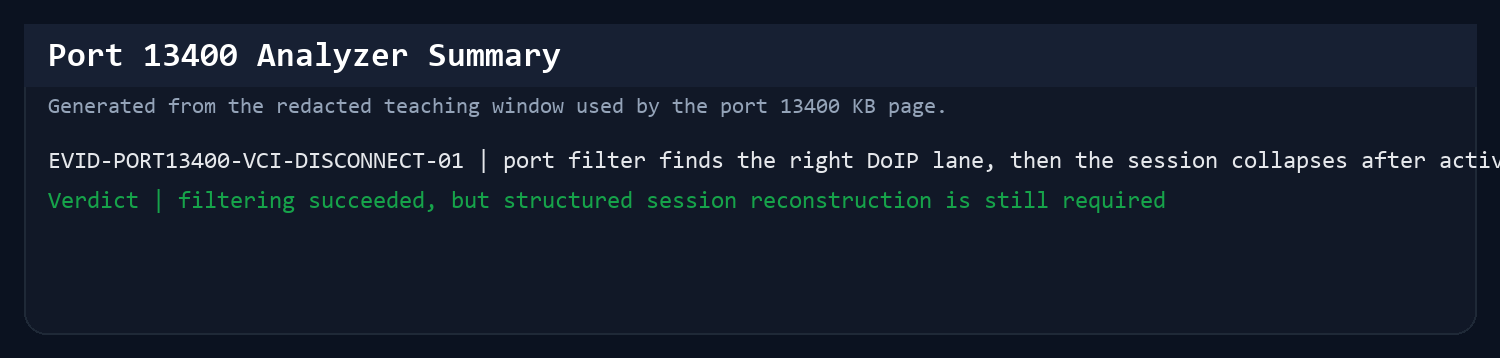
Generated from the redacted teaching window used by the port 13400 page.
Evidence reference: EVID-PORT13400-VCI-DISCONNECT-01
Derived from: EVID-PORT13400-VCI-DISCONNECT-01
Normalized by: DiagAgent
Original packet count: compact activation window extracted from a larger field capture
Timeline
Read this as a role-based swimlane: it shows observed request/response order, not an unproven causal chain.
Observed: Correct DoIP transport lane found, but the session fails after activation
Not established: Not determined from this retained window; the rapid FIN sequence supports a post-activation transport-stability check.
Next check: Anchor the first transport teardown event after Routing Activation Response payload type 0x0006 (code 0x10) before adding more Wireshark display filters.
Tester
Gateway / ECU
Evidence boundary
TCP 13400 stream opens
Control-layer activation response 0x10 received
Only a tiny amount of diagnostic traffic appears
Session closes before a usable exchange forms
Priority FAQ
What Wireshark filter should I use for DoIP?
Start with tcp.port == 13400 || udp.port == 13400. That isolates the default DoIP transport lanes before deeper payload inspection.
When This Article Applies
Best for engineers who already know the port but still cannot reconstruct the failing exchange.
Capture-Backed Evidence
Each example identifies whether it is a controlled simulator observation or a redacted field-evidence window. The evidence record bounds what the sequence can and cannot establish.
Connection opens, routing activates, then the session is closed anyway
Vehicle identified, then VCI disconnects immediately
Evidence reference: EVID-PORT13400-VCI-DISCONNECT-01
Node roles in this case
- tester: the external diagnostic client
- gateway: the vehicle-side DoIP entry point
A compact field capture where the Routing Activation Response carries code 0x10, but the session is still lost immediately afterward.
Evidence signals
- 1 Routing Activation Request (0x0005) and 1 Routing Activation Response payload type 0x0006 carrying response code 0x10 were observed on TCP 13400.
- Only 2 UDS diagnostic payloads followed before the TCP session closed with a bidirectional FIN exchange.
- This is a strong example of why filtering by port alone does not prove the diagnostic session stayed healthy.
Timeline
- Packet 1231: the tester sends a Routing Activation Request to the gateway on TCP 13400.
- Packet 1233: the gateway responds with a Routing Activation Response payload type 0x0006 (response code 0x10), establishing the DoIP control-layer activation boundary.
- Packets 1243-1244: both sides issue FIN and the connection ends less than half a second later.
For the Wireshark port-13400 search intent, this is the exact moment where port filtering stops being enough and state reconstruction begins.
Analyzer Conclusion
This is the condensed engineering verdict the analyzer would put in front of the operator.
Summary judgment
port 13400 filtering found the correct DoIP stream, but the session collapsed immediately after activation.
Likely fault direction
investigate post-activation transport stability instead of assuming the filter or port selection is wrong.
Top action
trace the first packets after routing activation and identify the first teardown event before expanding Wireshark rules.
False Positives
These are cases where the tool symptom can point in the wrong direction unless the packet timeline is checked.
Symptom: The user assumes that seeing port 13400 traffic proves the DoIP session is healthy.
Packet truth: The capture shows activation followed by almost immediate session closure.
Risk: Time is wasted building more filters when the real issue is instability after the filter already succeeded.
Symptom: A clean routing activation response is read as proof that diagnostics completed normally.
Packet truth: Only one or two UDS frames appear before the TCP stream is torn down.
Risk: The operator may blame later tooling even though the usable session never really formed.
Decision Tree
Use this order in real troubleshooting so packet evidence narrows the branch before repair effort expands.
- 1. Filter for tcp.port == 13400 or udp.port == 13400 to isolate the candidate DoIP lane.
- 2. Confirm whether routing activation is actually present inside that lane.
- 3. Check the first UDS packets after activation and decide whether the session became operationally useful or died immediately.
- 4. If the path tears down quickly, stop adding display filters and switch to timeline reconstruction.
Common Misreads
These are the interpretation traps that real packet evidence helps avoid.
- Seeing traffic on TCP 13400 does not mean the diagnostic path remained stable after routing activation.
- A clean Routing Activation Response does not guarantee that the following UDS exchange completed.
- A short capture with only one or two UDS frames after activation is not a successful session. It is usually an interrupted session.
What to Filter First
Start with tcp.port == 13400 || udp.port == 13400 to isolate the core DoIP traffic lanes before inspecting individual payload types.
Once the transport stream is isolated, focus on routing activation, vehicle identification, and UDS request or response sequences rather than scanning the full capture blindly.
Useful Follow-Up Checks
After transport filtering, check whether the capture shows vehicle announcement traffic, routing activation, and then the diagnostic requests that matter to your failure point.
If the flow jumps between multiple source addresses or sessions, separate the tester-to-gateway path from ECU-specific traffic before drawing conclusions.
Why This Still Gets Messy
Raw packet views still require manual stitching across timing gaps, retransmissions, and mixed session traffic.
That is the point where a structured analyzer becomes more efficient than handcrafted filters alone.
When to Stop Filtering and Start Parsing
If you already know the port but still cannot tell which request triggered the failure, the bottleneck is no longer filtering. It is session reconstruction.
That is the handoff point where uploading the original capture is faster than building more custom Wireshark display rules.
More Frequently Asked Questions
Why is port filtering not enough on its own?
Because the real bottleneck is usually reconstructing session order, identifying the failing request, and separating overlapping exchanges.
Related Diagnostic Guides
Use nearby guides to move from protocol filtering to root-cause troubleshooting without leaving the knowledge base.