Knowledge Base
Last Updated: 2026-07-30
How to Read UDS NRC 0x78 Response Pending Timeouts
In UDS semantics, NRC 0x78 indicates that the ECU has not completed processing the request and will provide a later response.
Evidence Summary
Interpret the retained observation before assigning a diagnostic conclusion.
Observed
Multi-stage NRC 0x78 pending flow with branch ambiguity
Supported interpretation
Only the retained, approved observation is supported.
Not established
Repeated pending was flattened into a timeout-like symptom, while the actual wire story splits between recovery and degradation depending on the branch.
Recommended next check
Verify the first terminal response after each pending loop before retrying the operation or blaming ECU processing time alone.
Visual Evidence
These panels are reviewed, public-safe, role-based event summaries. They are not raw packet captures or screenshots.
Wireshark Evidence Window: Multi-Stage Pending
Generated from the redacted sample for EVID-NRC78-ADC-PENDING-01.
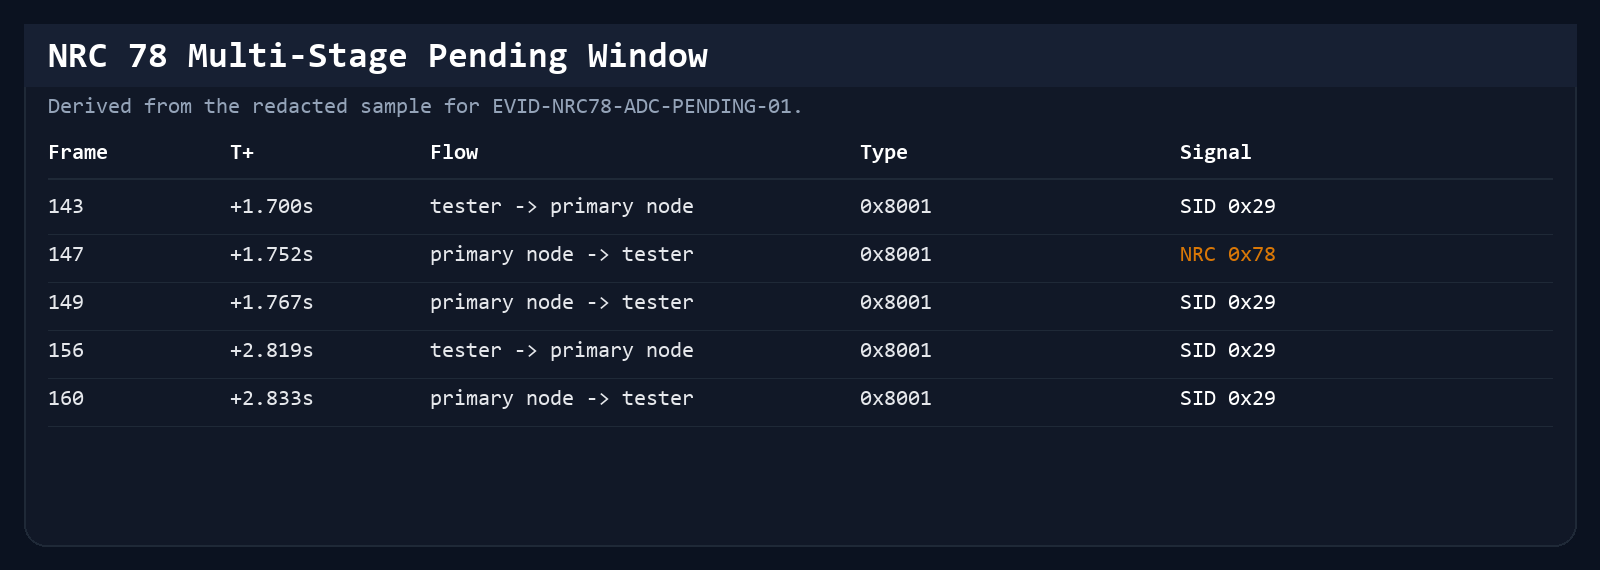
Evidence reference: EVID-NRC78-ADC-PENDING-01
Derived from: original frame window 132-823
Normalized by: DiagAgent
Original packet count: 40,647
Wireshark Evidence Window: Late Pending Then Positive
Generated from the redacted sample for EVID-LATE-PENDING-SRS-01.
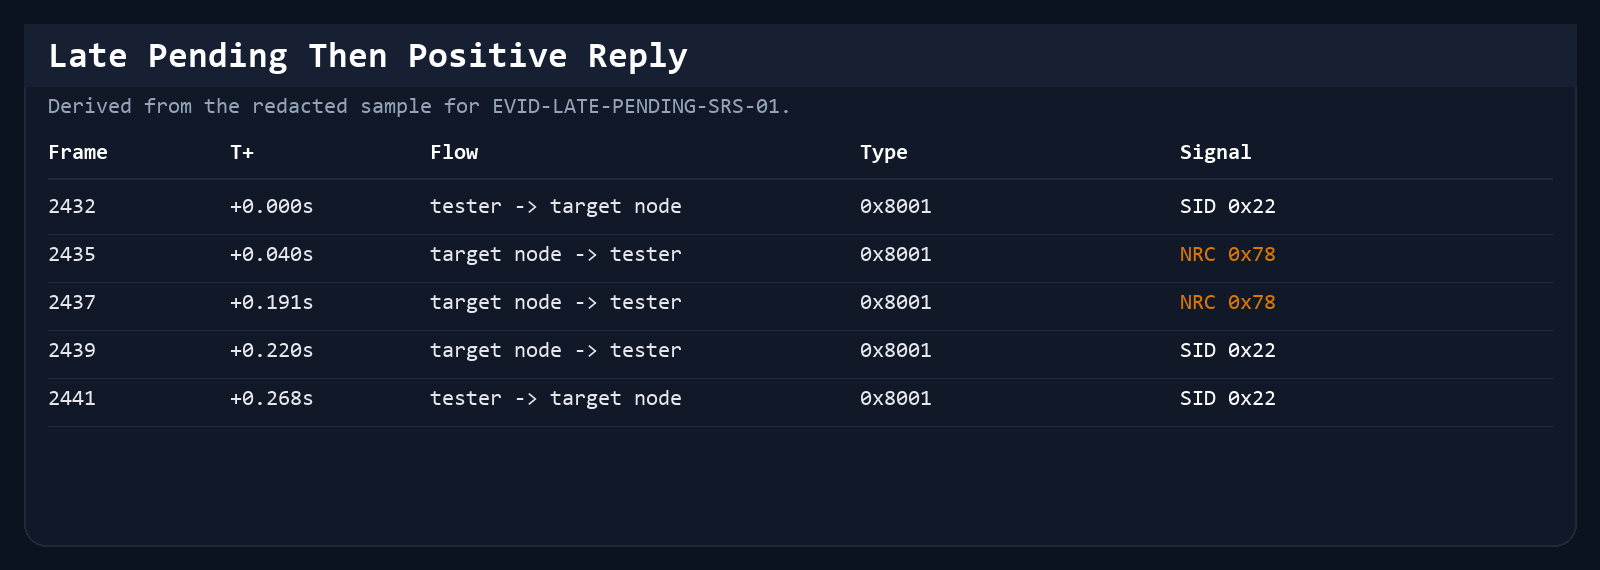
Evidence reference: EVID-LATE-PENDING-SRS-01
Derived from: original frame window 2432-2448
Normalized by: DiagAgent
Original packet count: sample window extracted from a longer SRS stream
Wireshark Evidence Window: Pending To Failure
Generated from the redacted sample for EVID-NRC78-FAILURE-BRANCH-01.
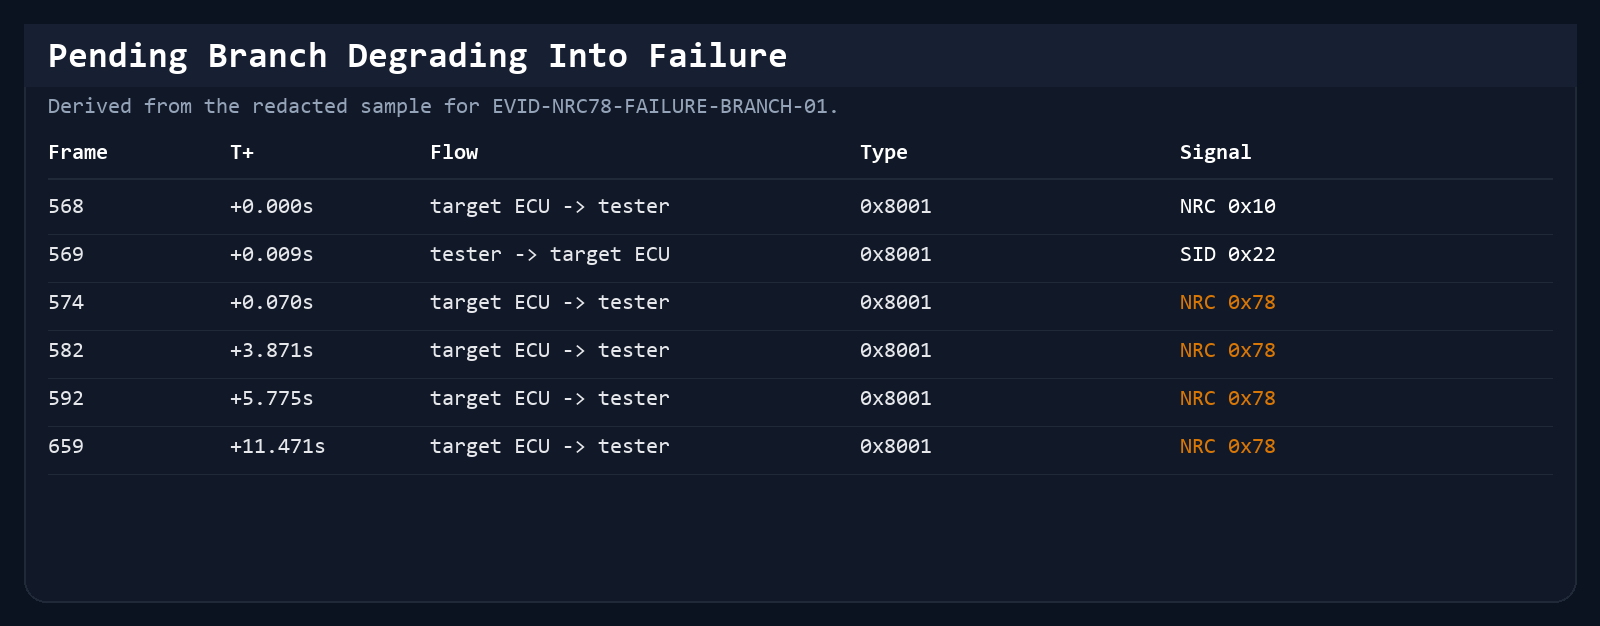
Evidence reference: EVID-NRC78-FAILURE-BRANCH-01
Derived from: original frame window 568-713
Normalized by: DiagAgent
Original packet count: sample window extracted from a longer failure capture
Analyzer Summary Screenshot
Generated from the redacted teaching windows used by the NRC 78 page.
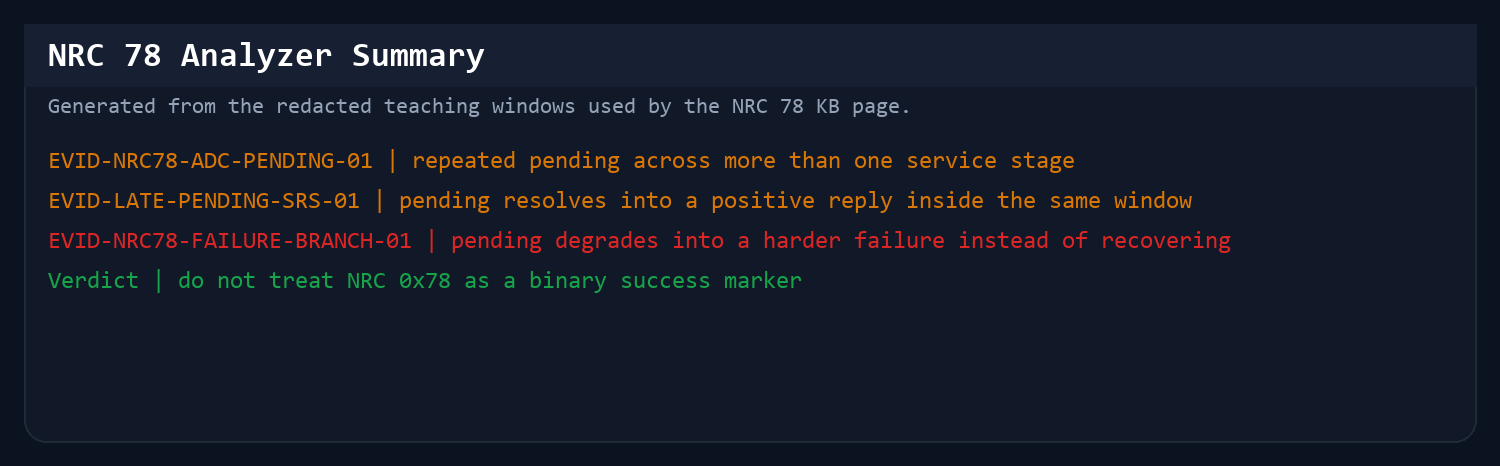
Evidence reference: EVID-NRC78-ADC-PENDING-01 + EVID-LATE-PENDING-SRS-01 + EVID-NRC78-FAILURE-BRANCH-01
Derived from: EVID-NRC78-ADC-PENDING-01 + EVID-LATE-PENDING-SRS-01 + EVID-NRC78-FAILURE-BRANCH-01
Normalized by: DiagAgent
Original packet count: 40,647 + longer SRS stream + longer failure capture
Timeline
Read this as a role-based swimlane: it shows observed request/response order, not an unproven causal chain.
Observed: Multi-stage NRC 0x78 pending flow with branch ambiguity
Not established: Repeated pending was flattened into a timeout-like symptom, while the actual wire story splits between recovery and degradation depending on the branch.
Next check: Verify the first terminal response after each pending loop before retrying the operation or blaming ECU processing time alone.
Tester
Gateway / ECU
Evidence boundary
Read / flash request starts
NRC 0x78 pending
NRC 0x78 pending repeats
Positive reply or harder failure
Priority FAQ
Is NRC 0x78 always an error?
No. It means the request is still pending under the UDS protocol. The important question is what happened after the pending phase.
When This Article Applies
Best when a flashing or erase operation stalls and the tool only shows a timeout.
Capture-Backed Evidence
Each example identifies whether it is a controlled simulator observation or a redacted field-evidence window. The evidence record bounds what the sequence can and cannot establish.
ADC log extraction with repeated pending states on multiple SIDs
ADC extraction case with repeated Response Pending states
Evidence reference: EVID-NRC78-ADC-PENDING-01
Node roles in this case
- tester: the extraction client
- primary node: the first node that enters pending
- gateway-adjacent node: the later node that also returns pending
A long v3 DoIP capture where response-pending appears in more than one stage, which makes it a useful anti-misread example.
Evidence signals
- ISO 13400-2 v3 transport is confirmed across 40,647 packets.
- NRC 0x78 appears on SID 0x29 at +51.878 s, then later on SID 0x38 at +74.823 s and again around +156.332 s.
- The same file shows that 'pending' is not a single event. It is part of a broader timeline that must be followed forward.
Timeline
- +51.878 s: one diagnostic node emits SID 0x29 / NRC 0x78.
- +74.823 s: a gateway-adjacent node emits SID 0x38 / NRC 0x78.
- +156.241 s and +156.332 s: the file returns to pending behavior on SID 0x37 and SID 0x38 instead of ending cleanly.
Real Timeline
- +51.878 s | primary node | SID 0x29 returns NRC 0x78 | The first pending phase appears.
- +74.823 s | gateway-adjacent node | SID 0x38 returns NRC 0x78 | A second service family also enters pending.
- +156.241 s | same path | SID 0x37 repeats near the late-stage transition | The flow remains transitional rather than cleanly terminal.
- +156.332 s | same path | SID 0x38 returns NRC 0x78 again | The pending condition persists late into the workflow.
Sanitized Message Snippets
- tester -> primary node | UDS SID 0x29 | result: NRC 0x78 | note: pending begins
- tester -> gateway-adjacent node | UDS SID 0x38 | result: NRC 0x78 | note: second stage also pending
- tester -> same path | UDS SID 0x37 / 0x38 | result: repeated transition traffic | note: continuity still unresolved
Why the analyzer concluded this
- More than one pending transition appears on different services, so the analyzer should not collapse the case into one generic timeout.
- The preserved window ends in a still-transitional state rather than a positive completion, so 'pending means healthy' would overstate the evidence.
- Relative timing shows that delayed behavior persists across separated phases, not just one isolated frame.
This supports the KB claim that NRC 78 should be read as a state transition problem, not as a binary success-or-failure marker.
A clean readout window later transitions into pending before recovering
SRS data-stream window entering late Response Pending
Evidence reference: EVID-LATE-PENDING-SRS-01
Node roles in this case
- tester: the readout client
- target node: the node that first returns repeated pending responses
A short derived window from a longer real capture that shows a normal read sequence entering repeated pending states before a positive response returns.
Evidence signals
- The window starts with a normal ReadDataByIdentifier flow rather than an immediate failure.
- The target node then emits repeated SID 0x22 / NRC 0x78 responses before eventually returning SID 0x62.
- This makes it a stronger teaching sample than a timeout screenshot because the full state transition is preserved in one compact window.
Timeline
- A normal read request is sent to the target node.
- The same node returns repeated NRC 0x78 responses for SID 0x22 instead of failing outright.
- The pending loop ends with a positive SID 0x62 response, showing that pending and success can coexist in one short exchange.
Real Timeline
- window start | tester | SID 0x22 request enters a normal readout flow | The exchange starts healthy.
- mid-window | target node | Repeated NRC 0x78 on SID 0x22 | The node delays completion while keeping the session alive.
- window end | target node | Positive SID 0x62 response returns | The pending phase resolves successfully.
Sanitized Message Snippets
- tester -> target node | UDS SID 0x22 | request: read data identifier
- target node -> tester | UDS SID 0x22 | result: NRC 0x78 | note: processing continues
- target node -> tester | UDS SID 0x62 | result: positive response | note: pending resolved
Why the analyzer concluded this
- A positive SID 0x62 is observed after the repeated NRC 0x78 frames, so the analyzer can classify this as pending-then-recovery.
- The service family stays consistent through the short window, which reduces ambiguity about which request the final response belongs to.
This is a strong public-safe sample because it teaches the pending-state concept without requiring brand-specific addresses or full vehicle context.
A long pending phase can branch into a harder failure instead of recovery
Pending-to-failure branch in a repeated SID 0x22 workflow
Evidence reference: EVID-NRC78-FAILURE-BRANCH-01
Node roles in this case
- tester: the diagnostic client
- target ECU: the ECU that first returns repeated pending responses
- gateway-facing responder: the responder that later surfaces the harder failure state
This case fills the key missing contrast for the NRC 78 page. The same workflow that spends a long time in Response Pending does not recover cleanly; it later surfaces a harder failure condition instead.
Evidence signals
- The target ECU first emits repeated SID 0x22 / NRC 0x78 responses over a prolonged interval.
- The pending loop does not end in a clean positive completion inside the teaching window.
- Instead, a later branch in the same sequence surfaces a harder failure state, showing why engineers must not treat repeated pending as proof of eventual success.
Timeline
- The target ECU first rejects the same service with NRC 0x31 in the lead-in phase.
- The workflow then enters a sustained SID 0x22 / NRC 0x78 loop over multiple repeats.
- Later in the same sequence, the session surfaces a harder failure state rather than a clean positive completion.
Real Timeline
- lead-in | target ECU | NRC 0x31 appears before the long pending loop | The workflow already shows friction before repeated pending dominates.
- middle phase | target ECU | Repeated SID 0x22 / NRC 0x78 | The ECU keeps the request open without clean completion.
- later branch | gateway-facing responder | A harder failure state replaces the pending loop | The delayed path degrades instead of recovering.
Sanitized Message Snippets
- target ECU -> tester | UDS SID 0x22 | result: NRC 0x78 (repeated)
- gateway-facing responder -> tester | session branch | result: harder failure state
Why the analyzer concluded this
- No positive completion appears inside the preserved teaching window after the repeated NRC 0x78 sequence.
- A later harder failure branch is visible on the same workflow, so the analyzer can classify this as pending-to-failure rather than pending-only.
With this sample, the NRC 78 page can now show both branches: pending that eventually recovers and pending that turns into failure.
Packet Evidence
These packet-level checkpoints are the smallest proof units behind the article narrative.
Frame 351
tester -> target node
SID 0x22 request enters the readout workflow.
Use this as the anchor request before reading any pending state.
Frame 352
target node -> tester
SID 0x22 returns NRC 0x78.
Confirms the ECU kept the request alive instead of rejecting it outright.
Frame 353
target node -> tester
The next branch resolves to SID 0x62 or degrades later.
This is the decisive frame family for telling recovery from false optimism.
Analyzer Conclusion
This is the condensed engineering verdict the analyzer would put in front of the operator.
Summary judgment
repeated NRC 0x78 states were detected across more than one service stage; do not treat this as a single timeout event.
Likely fault direction
distinguish pending-then-recovery from pending-then-failure by checking the first terminal response after the loop.
Top action
inspect the first branch that breaks the repeated 0x78 pattern before retrying the workflow.
False Positives
These are cases where the tool symptom can point in the wrong direction unless the packet timeline is checked.
Symptom: The tool shows one generic timeout banner.
Packet truth: The capture contains several NRC 0x78 responses on different services, and one branch later recovers cleanly.
Risk: The operator may restart the wrong phase because the UI symptom hides the branch split.
Symptom: Repeated pending is treated as proof that the ECU is still healthy and will eventually finish.
Packet truth: One sample in this page recovers, while another degrades into a harder failure state.
Risk: The retry decision becomes too optimistic even though packet evidence is mixed.
Decision Tree
Use this order in real troubleshooting so packet evidence narrows the branch before repair effort expands.
- 1. Find the first NRC 0x78 and bind it to the triggering SID.
- 2. Check whether the same request family later receives a positive response such as SID 0x62 or another terminal failure.
- 3. If the capture shows repeated 0x78 on different services, split the workflow by service stage before drawing one root cause.
- 4. If the session ends without a visible terminal response, check for disconnect, reset, or keep-alive continuity loss before blaming ECU processing time alone.
Common Misreads
These are the interpretation traps that real packet evidence helps avoid.
- An NRC 0x78 does not prove success. It only proves the ECU did not finish yet.
- A single timeout banner from the tool can hide several different pending phases on different services.
- If the first response after 0x78 is never checked, the operator may blame the wrong stage of the flashing workflow.
Why 0x78 Appears
It commonly appears during erase memory, download, or other heavy operations where the ECU cannot return a positive response immediately.
The real problem is usually not the 0x78 itself, but whether the client waited long enough and what the ECU emitted after that pending response.
How to Verify the Failure
Rebuild the timeline around the pending response and confirm whether the session ended with a positive response, another negative response, or a transport-level interruption.
This is especially important when a diagnostic tool reports a timeout without preserving the lower-level exchange.
Where Misreads Happen
Some tools collapse a long pending phase into a single timeout message, which hides whether the ECU kept responding correctly or whether the transport path died first.
If the capture includes repeated 0x78 responses, compare spacing and final outcome instead of assuming every pending loop means the ECU is healthy.
What to Extract from the Capture
The key evidence is the request that triggered the pending state, the number of pending responses, the gap between them, and the first response that breaks the loop.
That final transition often reveals whether the issue is ECU-side processing, tester impatience, or a broken session after erase or download starts.
More Frequently Asked Questions
Why do tools misreport NRC 0x78?
Many tools collapse repeated pending responses into a generic timeout and hide whether the ECU later returned success, a new failure, or nothing at all.
Related Diagnostic Guides
Use nearby guides to move from protocol filtering to root-cause troubleshooting without leaving the knowledge base.