Knowledge Base
Last Updated: 2026-07-30
How to Read pcapng Automotive Ethernet Diagnostic Logs
If you are new to automotive Ethernet captures, the first obstacle is turning raw packets into a usable diagnostic story.
Evidence Summary
Interpret the retained observation before assigning a diagnostic conclusion.
Observed
Readable diagnostic capture that benefits from staged reconstruction rather than blind packet scrolling
Supported interpretation
Only the retained, approved observation is supported.
Not established
The file is not unreadable; it simply crosses the density point where role-based windowing and structured parsing become more efficient than raw inspection.
Recommended next check
Choose one clean subwindow first, establish the healthy baseline, then compare denser branches against it.
Visual Evidence
These panels are reviewed, public-safe, role-based event summaries. They are not raw packet captures or screenshots.
Wireshark Clean Multi-ECU Baseline
Generated from the redacted sample for EVID-CLEAN-SUBWINDOW-SRS-01.
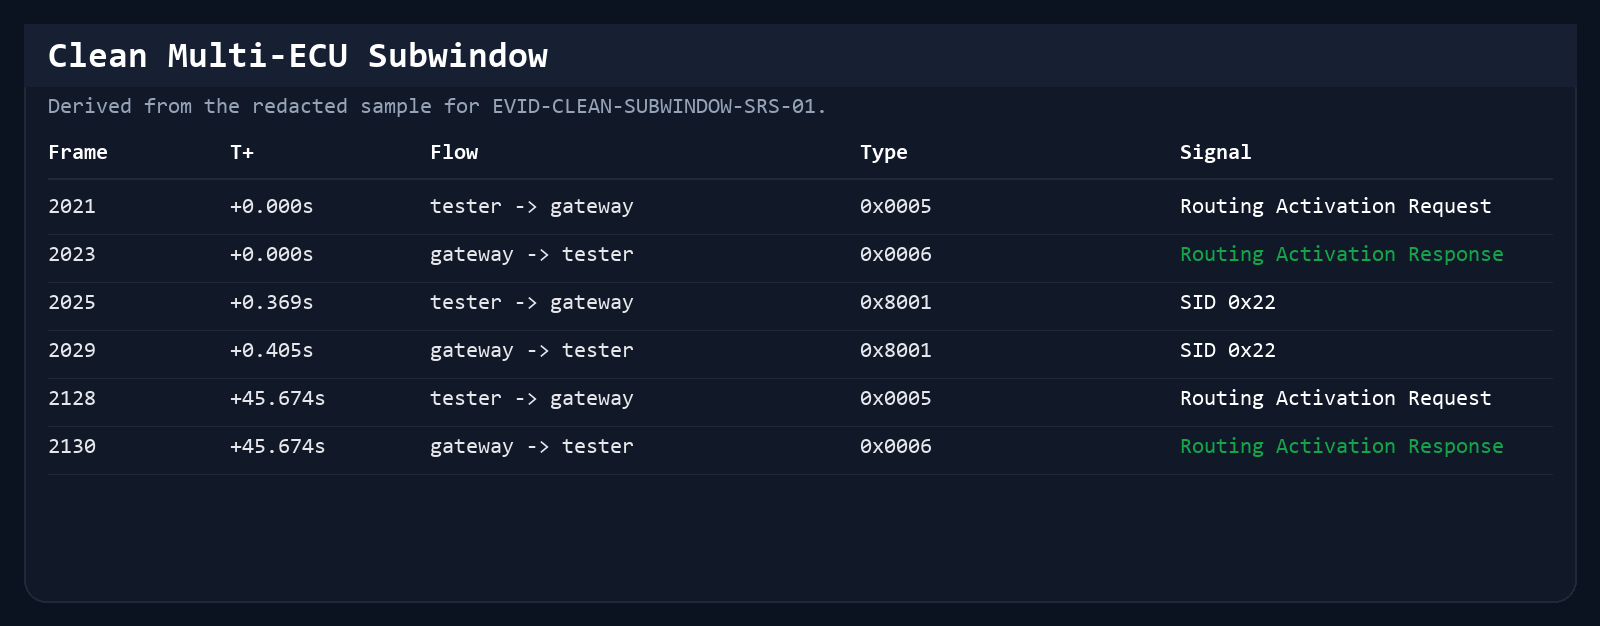
Evidence reference: EVID-CLEAN-SUBWINDOW-SRS-01
Derived from: original frame window 2021-2433
Normalized by: DiagAgent
Original packet count: sample window extracted from a longer SRS capture
Wireshark Compact Success Slice
Generated from the redacted sample for EVID-CLEAN-SUCCESS-WCM-01.
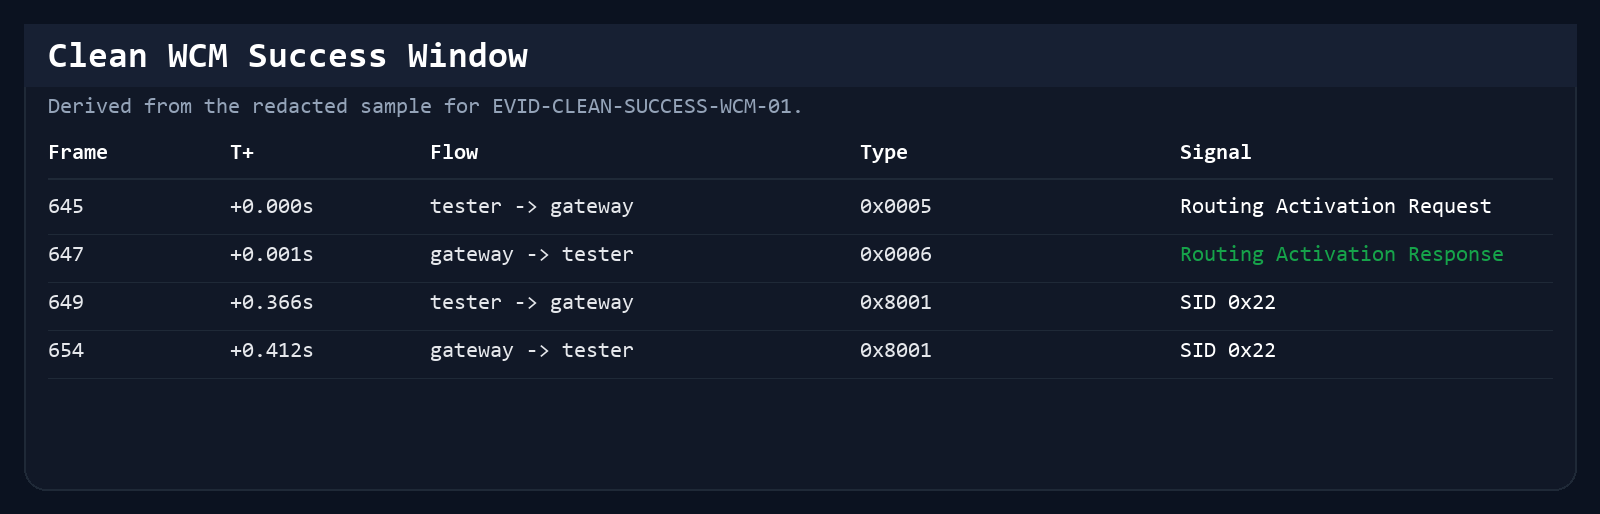
Evidence reference: EVID-CLEAN-SUCCESS-WCM-01
Derived from: original frame window 645-654
Normalized by: DiagAgent
Original packet count: short success slice extracted from a larger WCM readout
Wireshark Mixed Node-Flow Snapshot
Generated from the redacted sample for EVID-MIXED-TEACHING-NODEFLOW-01.
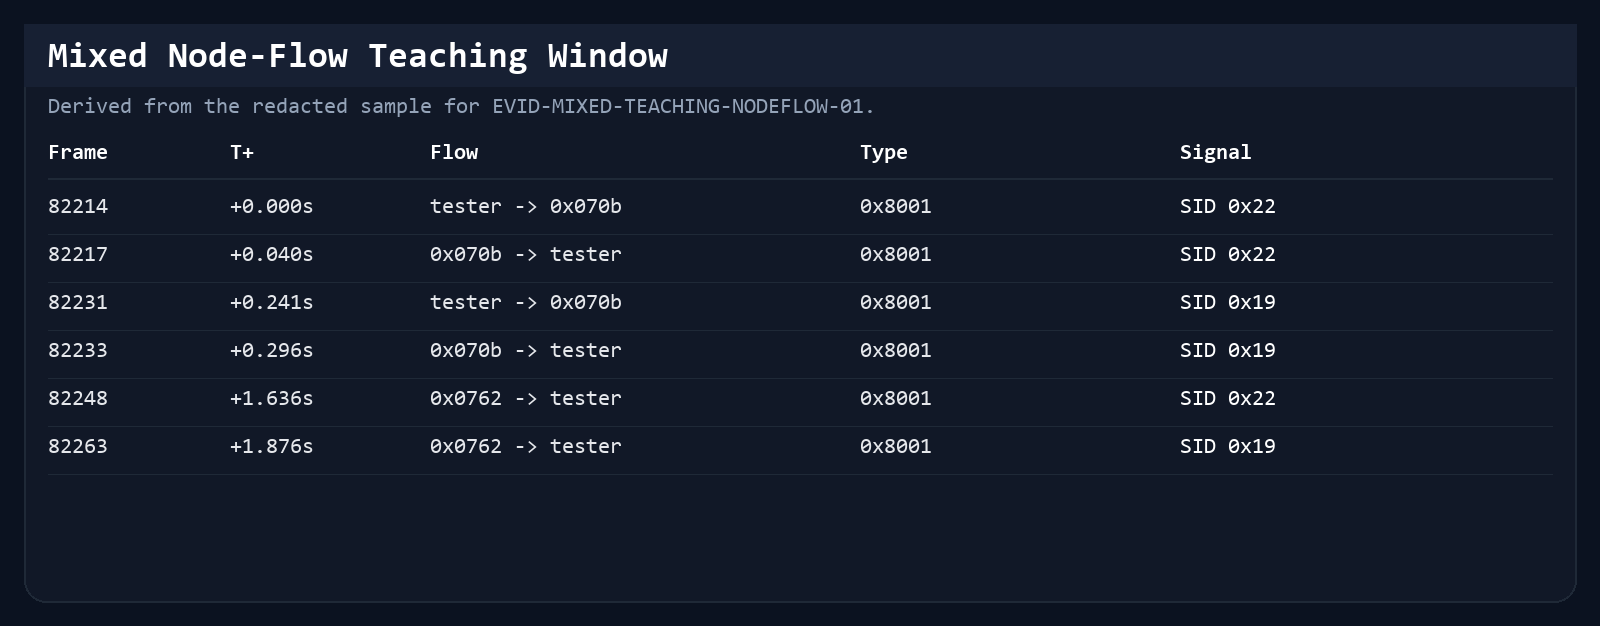
Evidence reference: EVID-MIXED-TEACHING-NODEFLOW-01
Derived from: original frame window 82214-82263
Normalized by: DiagAgent
Original packet count: dense node-flow window extracted from a larger mixed capture
Analyzer Summary Screenshot
Generated from the redacted teaching windows used by the pcapng reading page.
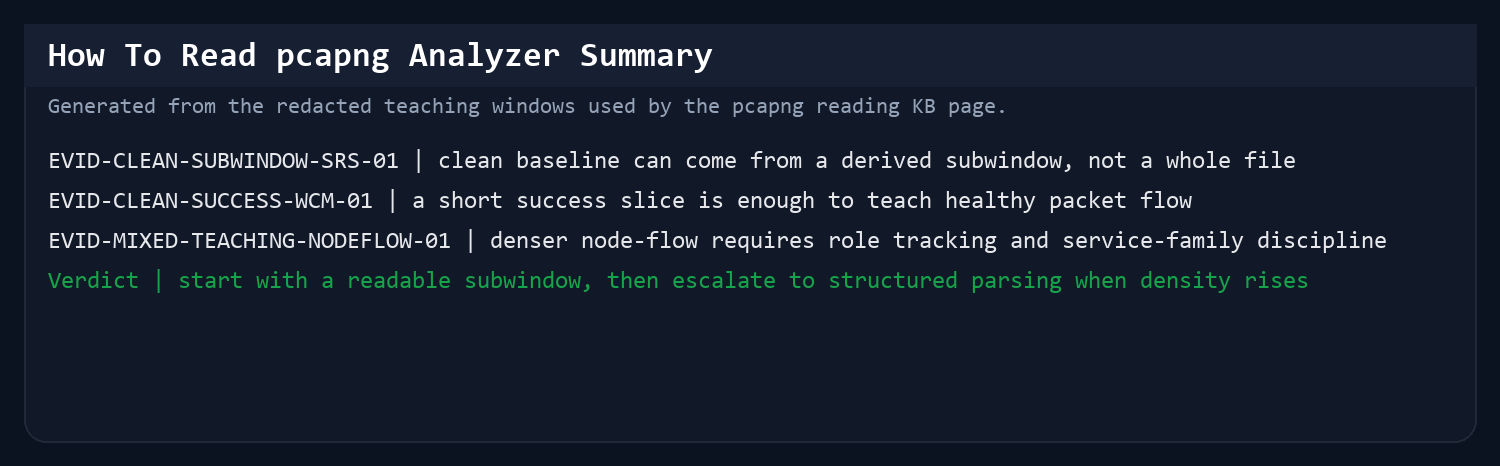
Evidence reference: EVID-CLEAN-SUBWINDOW-SRS-01 + EVID-CLEAN-SUCCESS-WCM-01 + EVID-MIXED-TEACHING-NODEFLOW-01
Derived from: EVID-CLEAN-SUBWINDOW-SRS-01 + EVID-CLEAN-SUCCESS-WCM-01 + EVID-MIXED-TEACHING-NODEFLOW-01
Normalized by: DiagAgent
Original packet count: multi-sample teaching set
Timeline
Read this as a role-based swimlane: it shows observed request/response order, not an unproven causal chain.
Observed: Readable diagnostic capture that benefits from staged reconstruction rather than blind packet scrolling
Not established: The file is not unreadable; it simply crosses the density point where role-based windowing and structured parsing become more efficient than raw inspection.
Next check: Choose one clean subwindow first, establish the healthy baseline, then compare denser branches against it.
Tester
Gateway / ECU
Evidence boundary
Identify routing activation and first UDS pair
Follow one target and service family forward
Handle density with node roles and transitions
Switch to structured reconstruction when manual reading stalls
Priority FAQ
What should I identify first in a DoIP pcapng file?
Start with discovery, routing activation, and the first meaningful UDS request or response chain. Those markers define the session structure.
When This Article Applies
Best for first-pass triage when the file is readable but operationally too dense to interpret quickly.
Capture-Backed Evidence
Each example identifies whether it is a controlled simulator observation or a redacted field-evidence window. The evidence record bounds what the sequence can and cannot establish.
A public-safe multi-ECU baseline can come from a derived subwindow, not a whole file
Multi-ECU DoIP readout before the first pending state
Evidence reference: EVID-CLEAN-SUBWINDOW-SRS-01
Node roles in this case
- tester: the diagnostic client
- gateway: the DoIP entry point
- target ECU group: multiple queried diagnostic nodes
This derived window is cut from a longer real vehicle capture and shows why a clean teaching sample should be defined at subwindow level rather than file level.
Evidence signals
- The window contains routing activation, UDS request traffic, and positive SID 0x62 responses across multiple target nodes.
- It stops before the first pending state appears, so the reader can study the clean interaction pattern first.
- Because it is a derived window, it reflects real mixed-network captures without forcing the impossible standard of an all-DoIP full file.
Timeline
- Routing activation opens the diagnostic path.
- The tester queries multiple target nodes with repeated read requests.
- Several target nodes answer positively before the window ends, preserving a clean baseline for comparison.
This is the strongest example in the project for explaining that useful public evidence often comes from a well-chosen slice of a long real capture.
A second clean baseline can be much shorter than a full successful file
WCM readout window with clean activation and positive UDS replies
Evidence reference: EVID-CLEAN-SUCCESS-WCM-01
Node roles in this case
- tester: the diagnostic client
- gateway: the DoIP entry point
- target ECU: the ECU answering the read requests
This compact window shows that a public-safe success baseline does not need a long flash or data session. A short activation-plus-read sequence can be enough to teach what a healthy DoIP exchange looks like.
Evidence signals
- The window contains Routing Activation Request and Response before the first UDS read.
- The tester issues SID 0x22 and receives positive SID 0x62 responses without an actionable negative response in the same compact slice.
- Because the sample is short and clean, it is useful as a baseline contrast against later pending, reject, or disconnect cases.
Timeline
- The tester opens the DoIP path through a routing activation exchange.
- A read request is sent to the target ECU and acknowledged at the transport level.
- The target ECU answers positively with SID 0x62, completing a clean teaching-grade loop.
This complements the longer SRS-derived baseline by showing that a short, well-chosen success slice is often the clearest way to teach packet reading.
A mixed teaching window can stay public-safe while still showing real protocol density
Node-flow case with repeated read and status transitions across multiple targets
Evidence reference: EVID-MIXED-TEACHING-NODEFLOW-01
Node roles in this case
- tester: the diagnostic client
- primary target: the first node in the read/status cycle
- secondary target: a second node reached in the same window
- tertiary target: another node appearing later in the same sequence
This is a stronger mixed-signal teaching case because it shows multiple protocol pairs in one compact slice. The reader has to track more than one target and more than one service family, but the window still stays readable.
Evidence signals
- The window contains repeated SID 0x22 / SID 0x62 read pairs and SID 0x19 / SID 0x59 status-style pairs.
- More than one target node appears in the same compact slice, which makes it realistic without becoming opaque.
- The window stays free of an immediate actionable negative response, so it works as a teaching sample rather than a failure-only sample.
Timeline
- The tester queries one target and receives positive read responses.
- The same flow then includes a status-style request/response pair before the sequence moves to another target node.
- A second and then a third target appear with similar positive read traffic, forcing the reader to follow the protocol story across nodes rather than reading one packet in isolation.
This is the closest current evidence sample to the real-world situation where a useful capture is not purely simple, but still readable if the engineer follows service families and target roles in order.
Packet Evidence
These packet-level checkpoints are the smallest proof units behind the article narrative.
Teaching window A
gateway / multiple targets
A clean multi-ECU subwindow shows routing activation and positive read responses.
This is the baseline pattern to learn before studying failures.
Teaching window B
tester -> target ECU
A short successful WCM slice proves a full file is not required to teach a healthy exchange.
A compact positive example is often more useful than a huge whole-file screenshot.
Teaching window C
multiple targets
A denser node-flow sample forces the reader to track more than one service family.
This is where an analyzer starts to outperform manual scrolling.
Analyzer Conclusion
This is the condensed engineering verdict the analyzer would put in front of the operator.
Summary judgment
the capture is readable at packet level, but a structured timeline is the faster path once node count and service density increase.
Likely fault direction
establish a baseline healthy subwindow first, then compare later pending, reject, or disconnect branches against it.
Top action
use routing activation, the first meaningful UDS pair, and target-role labeling as the minimum manual reading order.
False Positives
These are cases where the tool symptom can point in the wrong direction unless the packet timeline is checked.
Symptom: The file is dismissed as unreadable because it contains too many packets.
Packet truth: A smaller subwindow can still preserve a clean and teachable protocol story.
Risk: The analyst gives up before extracting a useful baseline from the file.
Symptom: The first visible noise on screen is mistaken for the main diagnostic story.
Packet truth: The useful path usually starts at routing activation and the first meaningful request/response chain, not at the first random hex block.
Risk: Manual reading effort is spent on background traffic instead of on the diagnostic branch.
Decision Tree
Use this order in real troubleshooting so packet evidence narrows the branch before repair effort expands.
- 1. Confirm that the file contains routing activation and meaningful UDS traffic, not just generic Ethernet chatter.
- 2. Choose one clean subwindow and one target role before reading thousands of packets in sequence.
- 3. Follow one service family forward until you hit a positive loop, pending branch, or hard failure.
- 4. If node count or mixed service density makes manual tracking unstable, switch to the analyzer and reconstruct the session as a timeline.
Common Misreads
These are the interpretation traps that real packet evidence helps avoid.
- Starting from random hex payloads is slower than starting from session boundaries and transport events.
- A large pcapng file can still be 'healthy' and worth reading even when the root cause is not visible in the first screen of packets.
- If a capture already shows active nodes, transport version, and pending or negative responses, you are past the point of simple file validation.
What to Look For
Start by identifying whether the file contains vehicle discovery, routing activation, and diagnostic request or response exchanges rather than generic background traffic.
Once those flows are clear, the next step is relating them to the point where flashing, coding, or diagnostics stopped behaving as expected.
Why Structure Matters
Reading thousands of hex bytes line by line is slow and error-prone when the real goal is understanding sequence, direction, and failure point.
A parser that restructures the capture into sessions and anomalies gives workshops and engineers a faster path to action.
A Practical Reading Order
Start at the beginning of the diagnostic exchange: identify discovery traffic, confirm routing activation, then trace the first meaningful UDS request and follow the response chain forward.
Do not start by scrolling randomly through payload bytes. Start by finding session boundaries and control transitions.
When an Online Parser Helps
If the file is technically readable but operationally too dense, the best next step is to convert it into a timeline of requests, responses, and anomalies.
That is the gap between having a capture and understanding why the vehicle interaction failed.
More Frequently Asked Questions
When should I stop reading packets manually?
Once you know the file contains the right traffic but can no longer track sequence, failure point, or control transitions reliably, it is time to switch to a parser.
Related Diagnostic Guides
Use nearby guides to move from protocol filtering to root-cause troubleshooting without leaving the knowledge base.